Banking supervision
The OeNB supervises Austrian banks in cooperation with the Financial Market Authority (FMA) and the European Central Bank (ECB). We analyse and examine whether banks comply with the regulatory framework. We also help ensure that banks are prepared for potential crisis situations, for example by requiring them to have appropriate recovery and resolution plans in place. If supervisors identify adverse developments or regulatory breaches at a bank, the FMA or the ECB will take action. This ensures that banks address deficiencies and reduce risks.


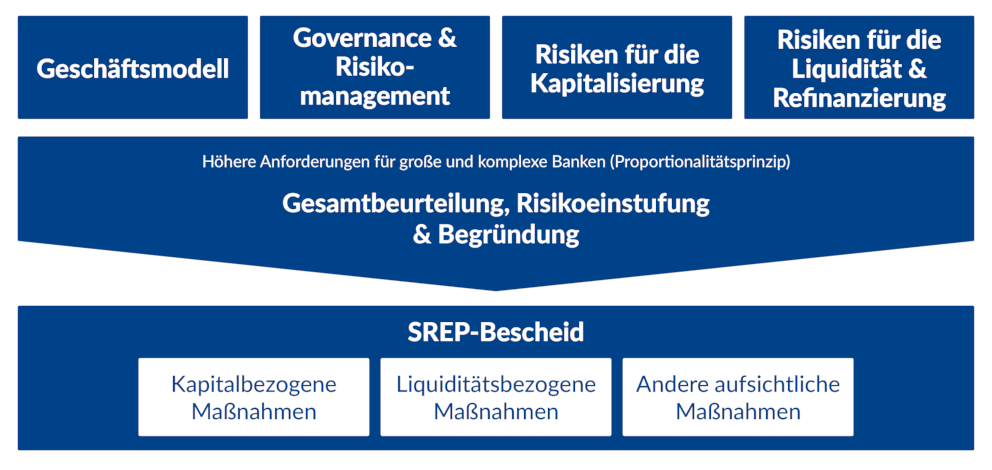
Illustration available in German only
Related links
- SSM: The Supervisory Review and Evaluation Process (SREP)
- EBA: Guidelines for common procedures and methodologies for the supervisory review and evaluation process (SREP) and supervisory stress testing
- LSI SREP: Überblick zu den Ergebnissen des SREP 2023 bei weniger bedeutenden Instituten (LSI) (PDF, 414 KB)
- LSI SREP: Überblick zum SREP inkl. methodischer Aspekte bei weniger bedeutenden Instituten (LSI) (PDF, 973 KB)
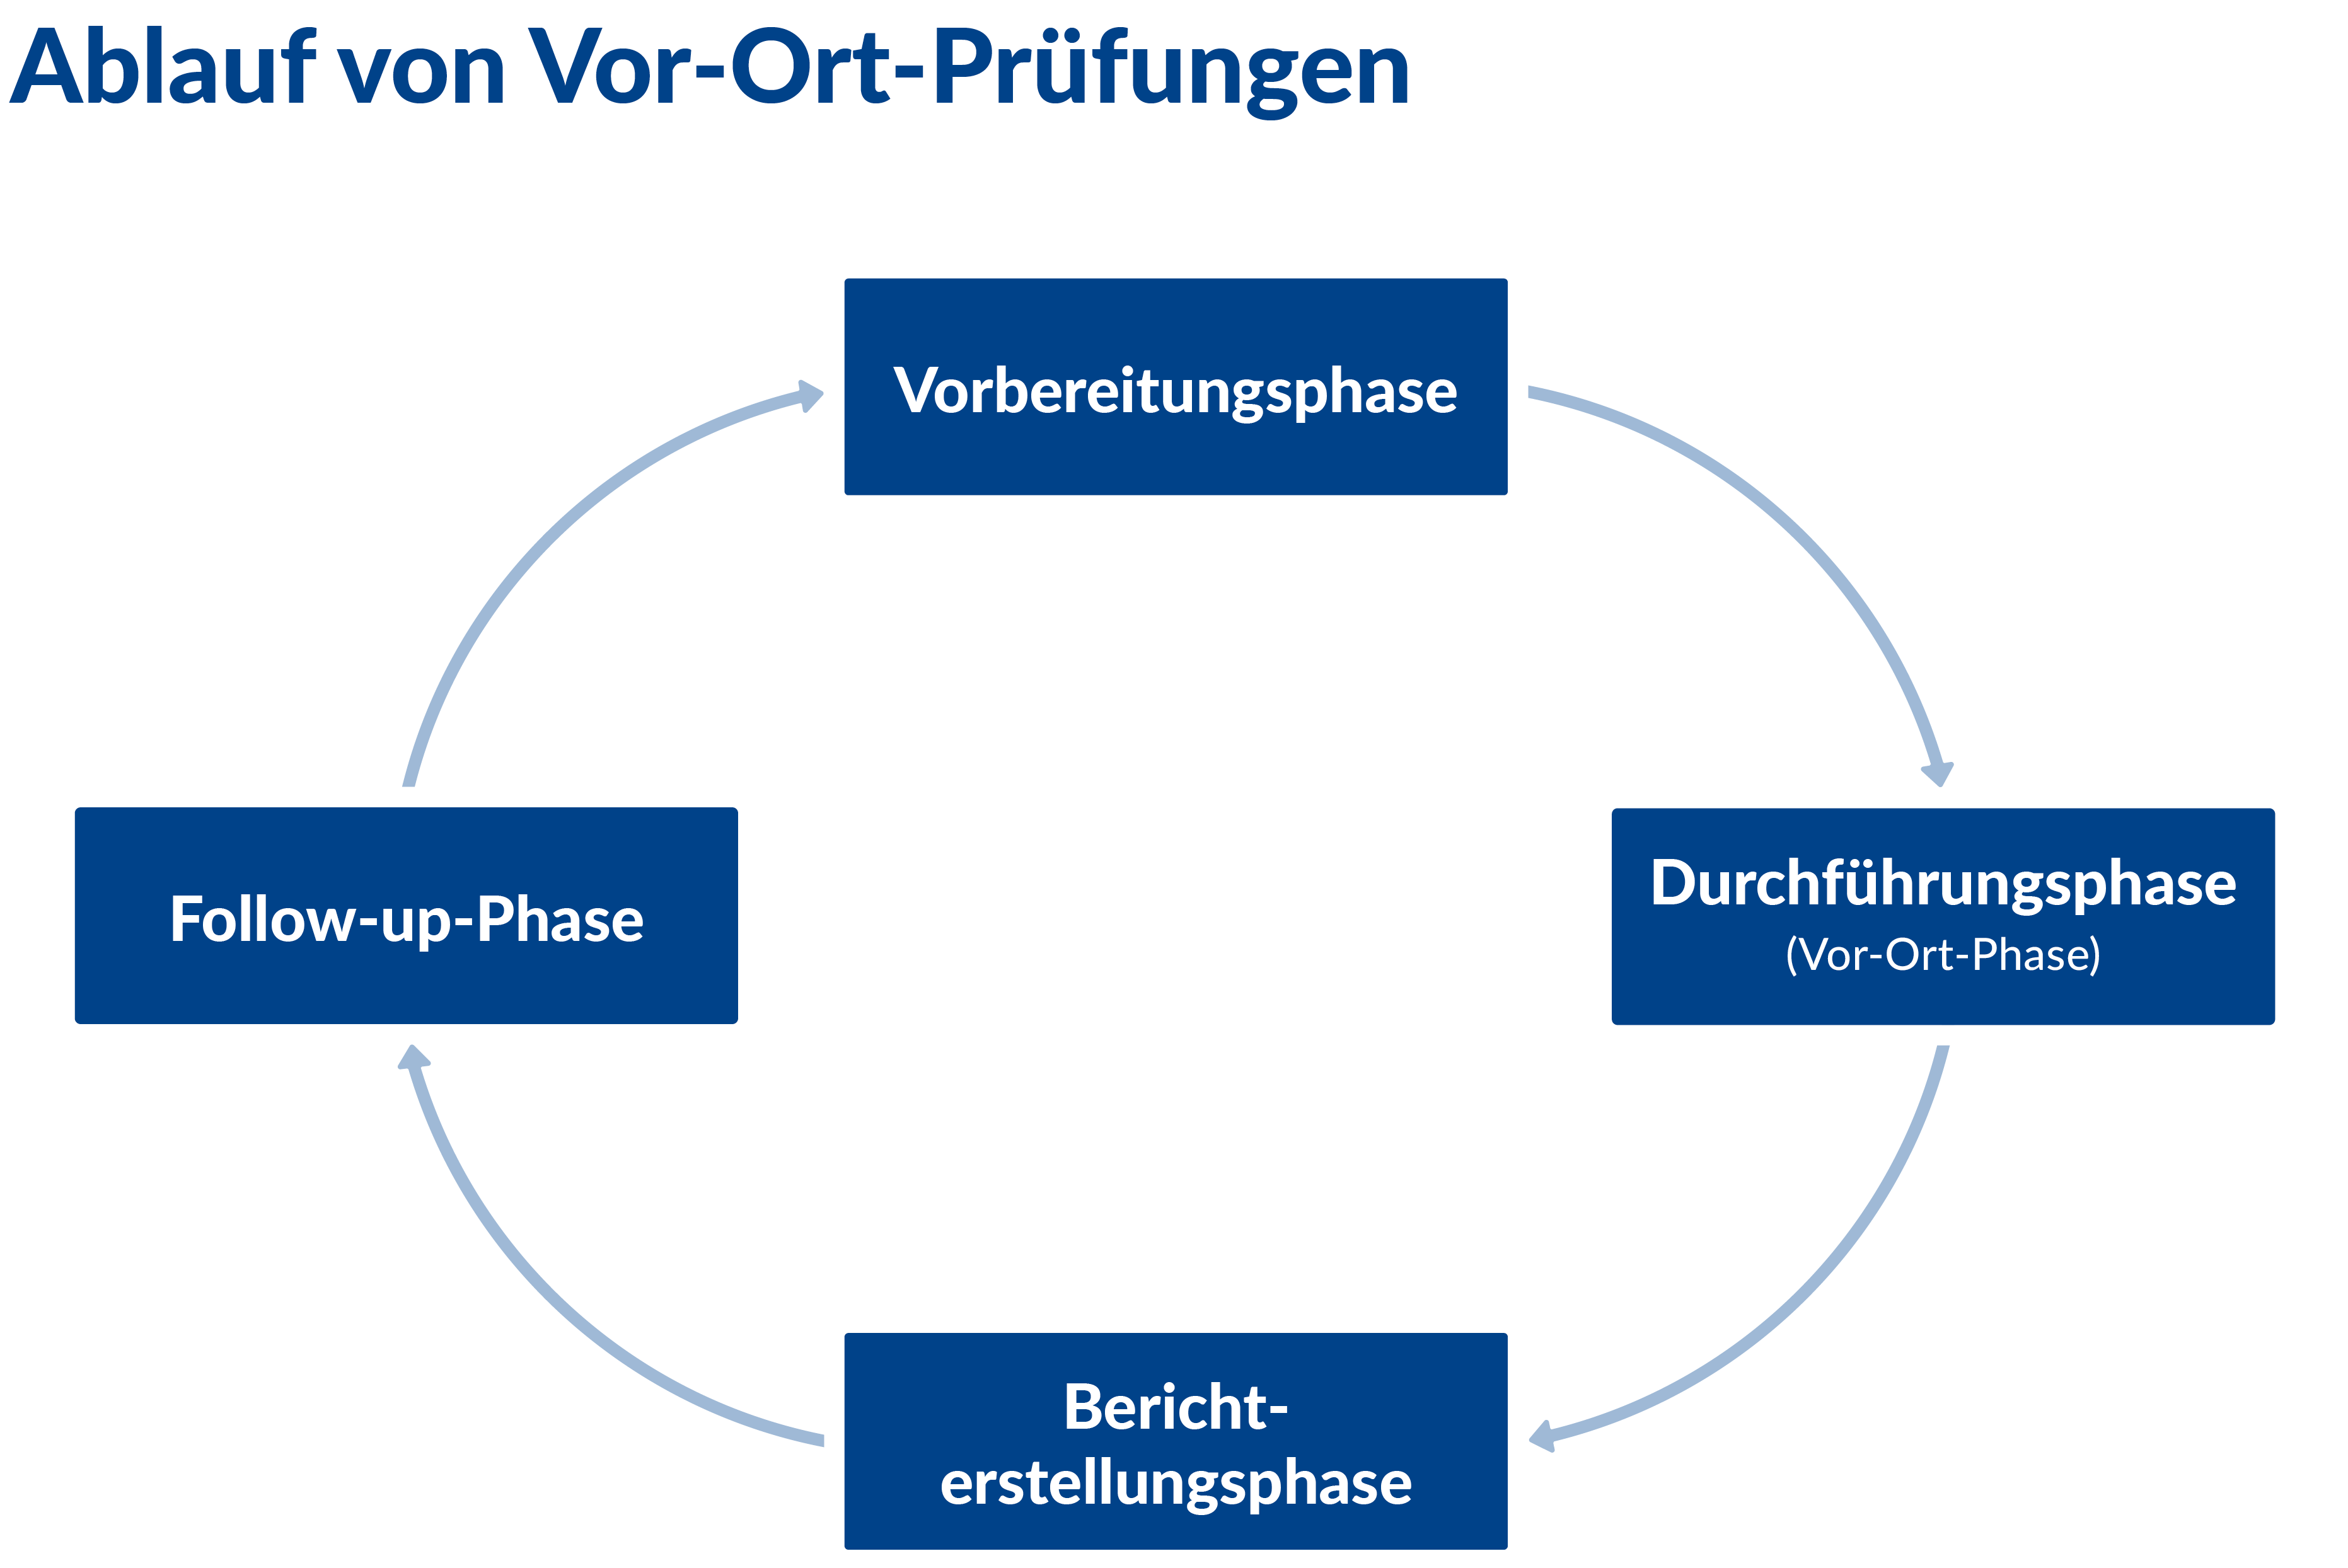
Illustration available in German only
Chart 13
Wir bedauern. Ihre Browserversion wird leider nicht unterstützt. Zur Ansicht dieser Funktion
benötigen
Sie eine neuere Browserversion oder einen anderen Browser.
Wir bedauern. Ihre Browserversion wird leider nicht unterstützt. Zur Ansicht dieser Funktion
benötigen
Sie eine neuere Browserversion oder einen anderen Browser.
Wir bedauern. Ihre Browserversion wird leider nicht unterstützt. Zur Ansicht dieser Funktion
benötigen
Sie eine neuere Browserversion oder einen anderen Browser.
Wir bedauern. Ihre Browserversion wird leider nicht unterstützt. Zur Ansicht dieser Funktion
benötigen
Sie eine neuere Browserversion oder einen anderen Browser.
Wir bedauern. Ihre Browserversion wird leider nicht unterstützt. Zur Ansicht dieser Funktion
benötigen
Sie eine neuere Browserversion oder einen anderen Browser.
Wir bedauern. Ihre Browserversion wird leider nicht unterstützt. Zur Ansicht dieser Funktion
benötigen
Sie eine neuere Browserversion oder einen anderen Browser.
Wir bedauern. Ihre Browserversion wird leider nicht unterstützt. Zur Ansicht dieser Funktion
benötigen
Sie eine neuere Browserversion oder einen anderen Browser.
Wir bedauern. Ihre Browserversion wird leider nicht unterstützt. Zur Ansicht dieser Funktion
benötigen
Sie eine neuere Browserversion oder einen anderen Browser.
Wir bedauern. Ihre Browserversion wird leider nicht unterstützt. Zur Ansicht dieser Funktion
benötigen
Sie eine neuere Browserversion oder einen anderen Browser.